
Prometheus is an open-source systems monitoring and alerting toolkit. It is basically a key value pair time series data model. In this blog post, we will use prometheus to monitor a spark ETL application. If you want to know more about prometheus, please read the official docs here
Problem Statement:
We will define a simple ETL spark job that will do the following operations
- Read directory of CSV files
- Convert the read records into parquet files
- Save the parquet files into a output directory
We want to be able to monitor how many records have been read and processed by the above job using prometheus.
Approach:
The diagram depicts the architecture of the solution we will design in this blog.
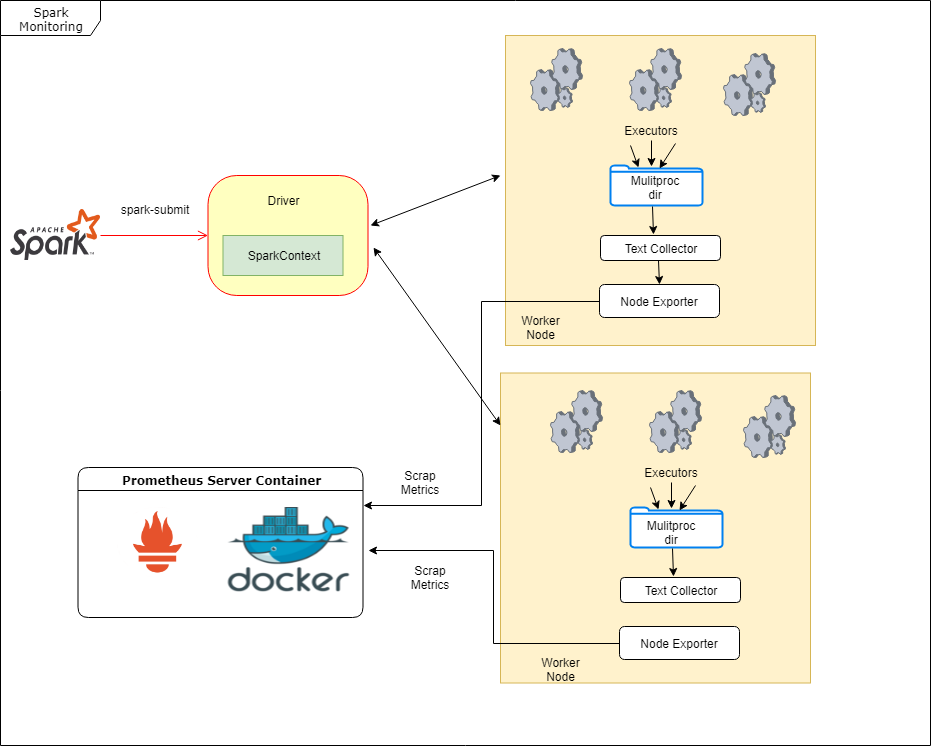
The spark job is carried out by multiple executors on various cluster worker nodes. We will be using using a combination of text collector and node exporter installed on the worker nodes to achieve monitoring goals. The executors in pyspark are python processes running in parallel. Each of the python process will increment the prometheus counter of the records they process. Each increment will be followed by flushing of the metrics after a minimum of 10 secs time interval to a file in a shared directory. The node exporter will use the text collector to scrape the prometheus metrics flushed earlier. Finally, the prometheus server will then scrape the node exporter metrics. Phew! 😕
Lets try to build a simple and similar setup to make some sense out of the above.
Spark Application:
The spark job is simple 🙂 and all what it does is essentially in the below code snippet
spark_df = spark.read.csv(path=input_path, inferSchema=True, header=True)

spark_df.write.parquet(path=output_path)
We will add a prometheus counter increment to the spark application. The counter will be incremented by the number of records we have read from the input directory. The same spark application will looks like below now.
spark_df = spark.read.csv(path=input_path, inferSchema=True, header=True)

pc = PipelineCounters()

#increment with the dataframe number of records

pc.increment_pipeline_counter('total_rec_proc', spark_df.count())

spark_df.write.parquet(path=output_path)
The metrics will be flushed to a text file every time the counter is incremented. As pyspark uses many short lived python process to execute a spark job, we will use the prometheus client in multiprocess mode. This needs to setup an environment variable prometheus_multiproc_dir
prom_dir = '/tmp/prom/'

if not os.path.exists(prom_dir):

os.makedirs(prom_dir)

os.environ['prometheus_multiproc_dir'] = prom_dir

registry = REGISTRY

multiprocess.MultiProcessCollector(registry)
def flush_metrics():

write_to_textfile(prom_dir+'pipeline.prom', registry=registry)
def periodic_flush_metrics():

current_time = time.time()

if get_last_flushed_time() + 10 < current_time:

flush_metrics()

set_last_flushed_time(current_time)
Node Exporter:
Next step will be to make the exported/flushed metrics available to the prometheus server to scrape. We will install the node exporter on the worker nodes and point the text collector to scrape the text file written out the pipeline executor process.
- Download the node exporter binary from the download page
- Extract the tar in an appropriate directory
- Start the node exporter as: ./node_exporter –collector.textfile.directory /tmp/prom
- You can view the exported metrics at localhost:9100/metrics
- Note down the ip address of the node. We will use the address later to point the prometheus server to scrape the node exporter metrics.
Prometheus Installation
We will using docker image to setup a prometheus. This installation expects docker installed on the target machine. For readers who are not familiar with docker and container based applications, please leave a comment below if you would want me do a blog on the topic.
The Dockerfile for the prometheus server is below:
FROM prom/prometheus

ADD prometheus.yml /etc/prometheus/
The prometheus configuration file will look like this
scrape_configs:

- job_name: spark-node-exporter

static_configs:

- targets : ["node-exporter-host:9100"]
The prometheus server can be started as below:
- Navigate to the directory of the Dockerfile
- Build and tag the prometheus server : docker build . -t prometheus-server
- Run the prometheus server: docker run -p 9090:9090
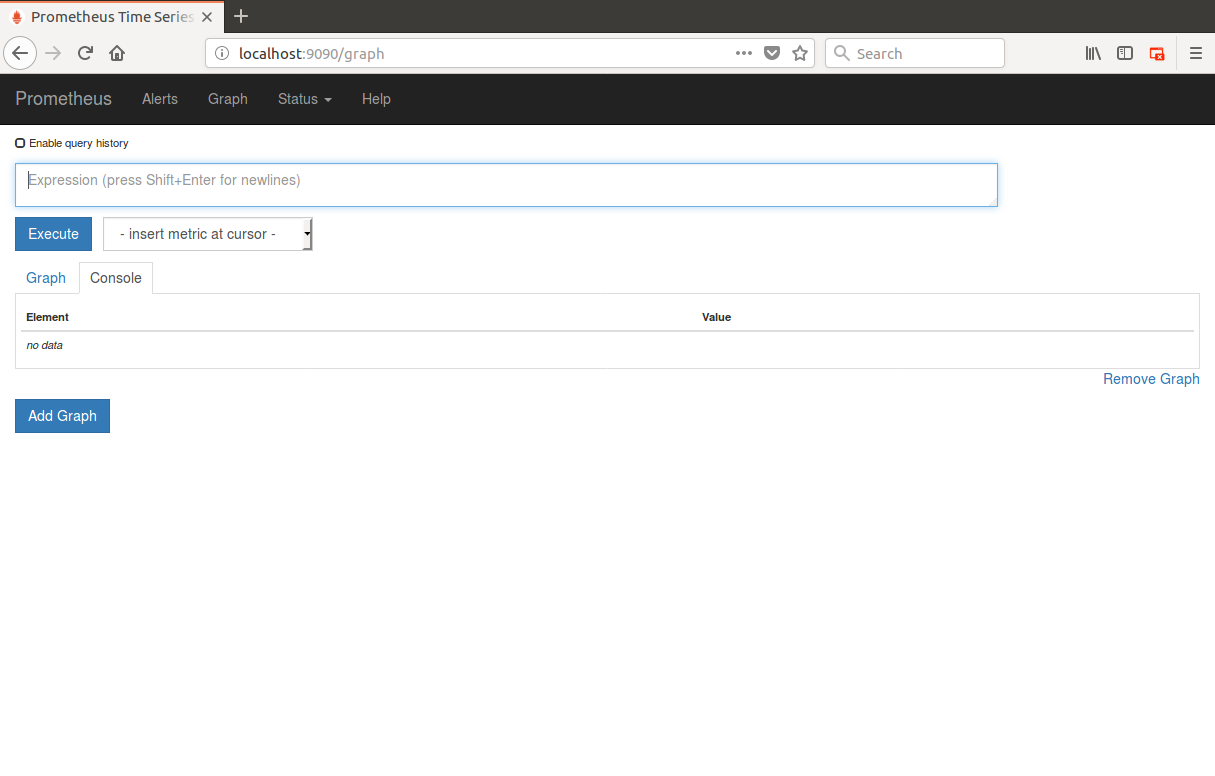
- Navigate to the url localhost:9090, you will find see the below page loaded:
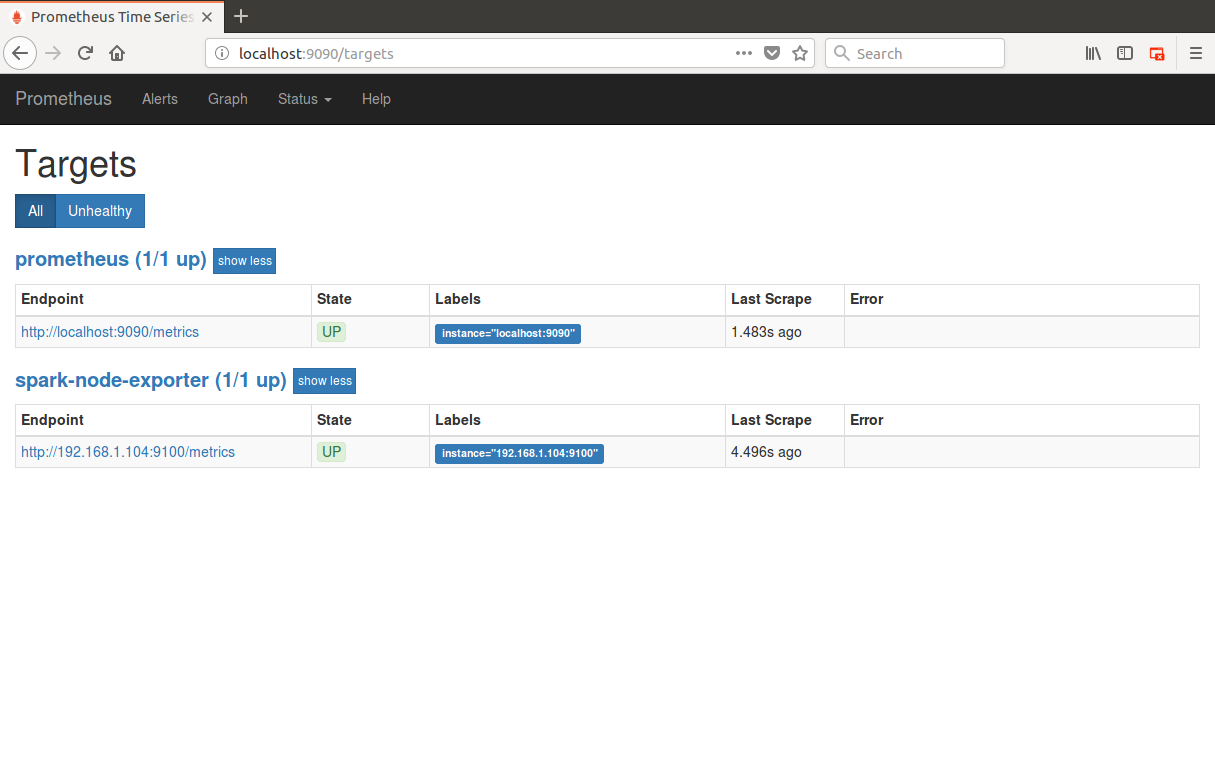
- We can view that prometheus is scraping the node exporter and the node exporter is up as below:
We are all ready now to run and monitor our spark job
Run the spark job:
We will run the spark job locally using spark-submit of our local spark installation. Please follow the link to download and extract an appropriate spark release (v2.3.1 is latest at the time of writing).
- cd to spark-installation/bin
- run ./spark-submit ~/devrats/spark-prometheus/src/main.py input_csv_dir output_dir
- After the job is completed you can verify the output folder to have the parquet files.
- Prometheus should have captured the total records processed. You can view the same by navigating to the URL : localhost:9090 and querying for the captured pipeline metrics as below:
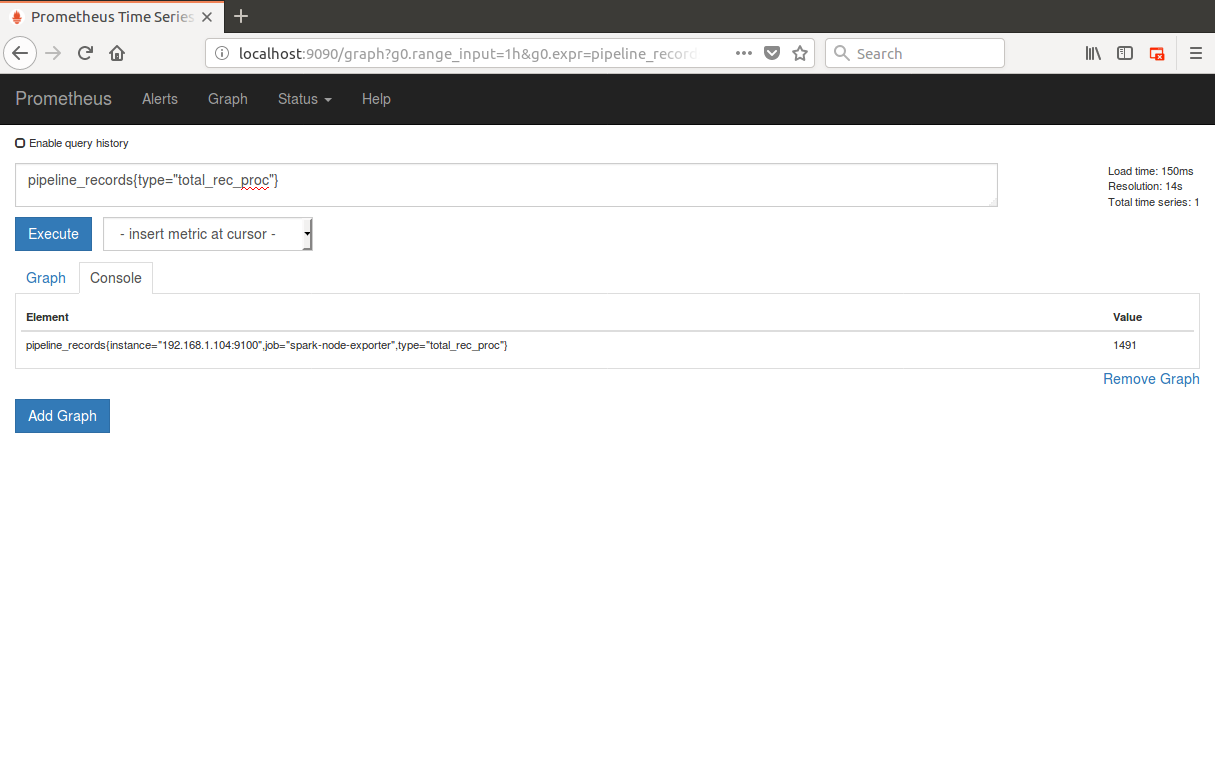
As seen in the above image, the prometheus is able show us that 1491 records were read from csv and converted to parquet by the Spark ETL.
You can find the code for the above demo here.
The above setup can be easily extended to multiple nodes spark cluster and prometheus can be used to monitor any spark application 🙂 Prometheus can help configure alerts and using Grafana we can do a nice dashboard for the captured metrics. Do leave a comment if you want me do a blog on alert manager and Grafana Dashboard.
Thanks for patiently reading the post. Please comment if any suggestion, feedback, queries or to simply say “Hi” . Cheers! 🙂
Some useful references:
- https://docs.docker.com/get-started/part2/#dockerfile
- https://prometheus.io/docs/prometheus/latest/configuration/configuration/
- https://prometheus.io/docs/prometheus/latest/installation/#using-docker
- PromCon 2017: Getting Apache Spark and Prometheus to Play Nicely
Short and precisely explained. It would be great if you can do a post on Prometheus in detail.
Sure Kushal. Will do few more on Prometheus soon.
Great site. Cheers for posting